


Safety
MassDOT is committed to advancing a future without transportation-related serious injuries and fatalities and eliminating the disparity in crash rates between Environmental Justice communities and all other groups. While our work is never complete when it comes to the safety of our residents, we are proud to report that safety has improved across all our MassDOT Divisions in FY25.
Following an increase in safety incidents as travel increased post-COVID, serious injuries on roadways decreased 4.3% from CY23 to CY24.
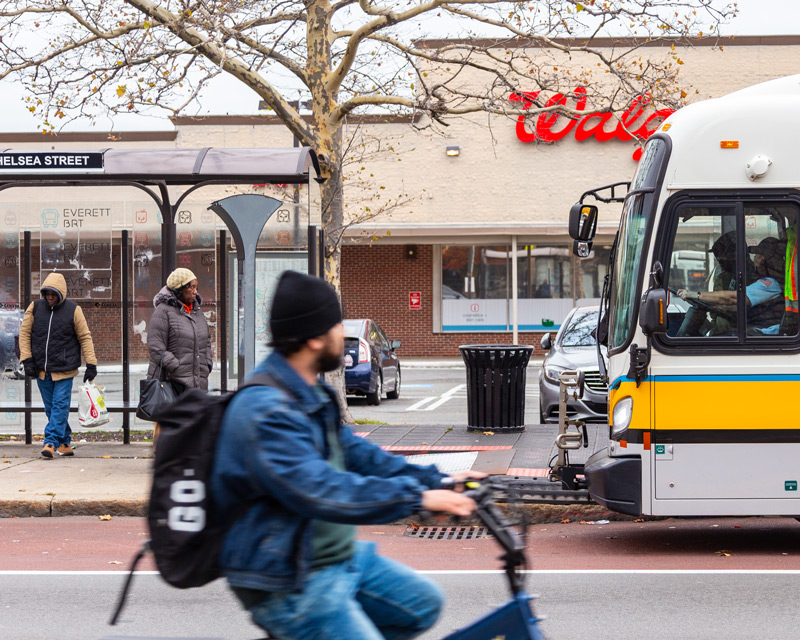
On transit, there were lower rates of safety events across the MBTA bus and subway systems, plus zero total fatalities across all 15 Regional Transit Authorities (RTAs).

The Commonwealth launched several new initiatives to meet safety standards and to help ensure that safety continues to improve for all users and employees.
One such initiative was the MBTA Track Improvement Program that implemented track repairs across all rapid transit lines to address long-term speed restrictions that were degrading the MBTA’s service quality.
The Track improvement Program enhanced safety, reduced delays and disruptions, improved train speeds and delivered timely, reliable, and consistent service for riders.
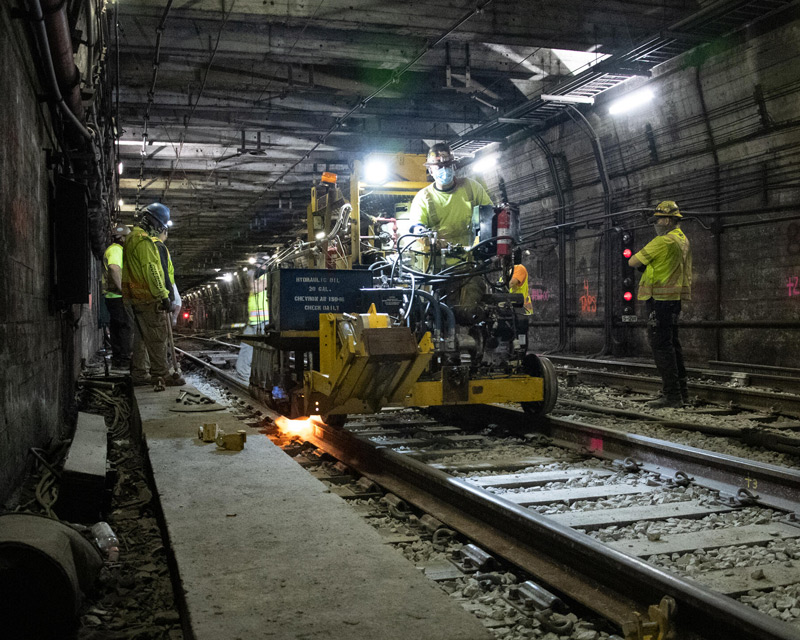
After replacing over 250,000 feet of rail, the MBTA eliminated over 220 speed restrictions–becoming completely restriction-free by December 2024–effectively resolving 40 years of repairs in 14 months.
This effort resulted in more efficient work scheduling, cross-department collaboration, and speed restrictions returning to a temporary safety measure. New speed restrictions opened from April – June of 2025 were removed in fewer than 3 days 77% of the time and the median restriction was removed in 2 days.
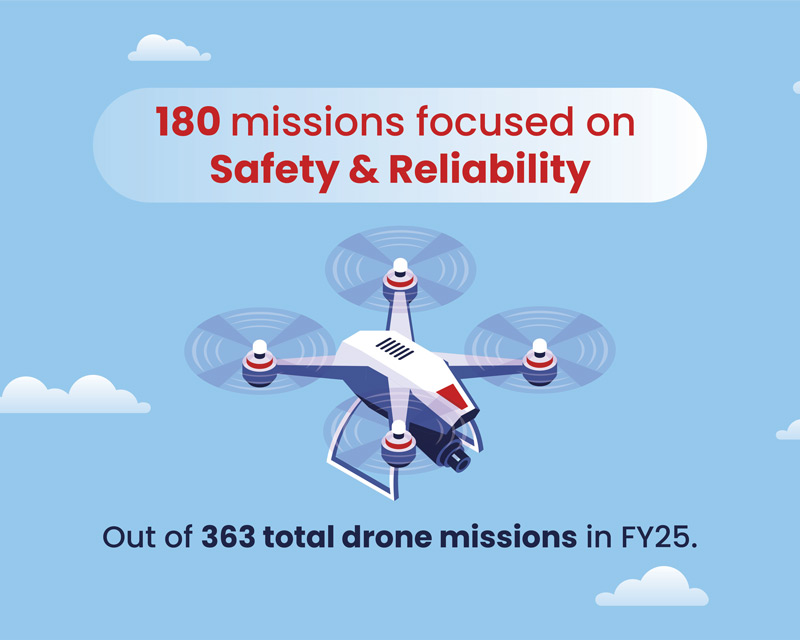
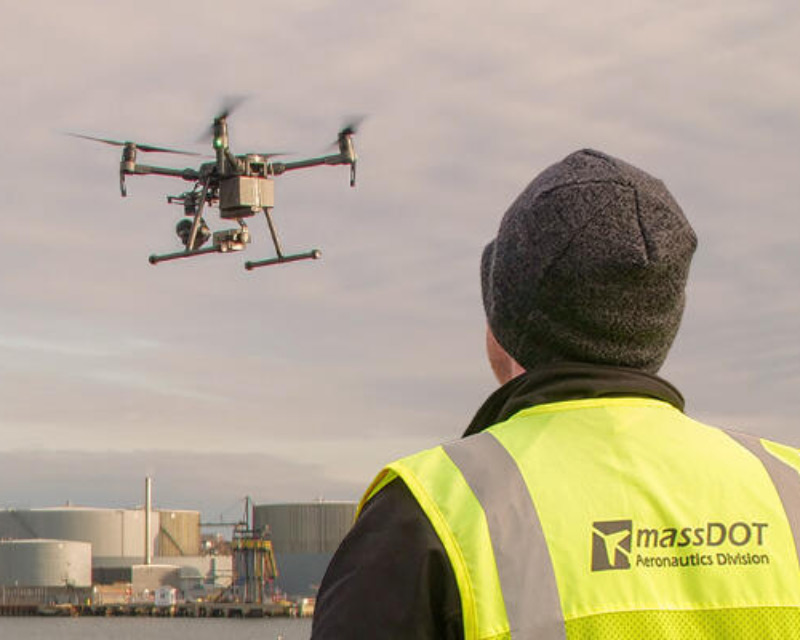
Across MassDOT, promoting safety in transportation is embedded in our day-to-day work. The RMV plays a central role in promoting roadway safety by overseeing driver licensing and suspensions, vehicle inspection and registration services, driver education, school transportation safety programs, crash reporting, and the ignition interlock program, while the Aeronautics Division manages regional airport inspections and has scaled up its support of safety-related preventative maintenance efforts across the Commonwealth through its drone mission program.
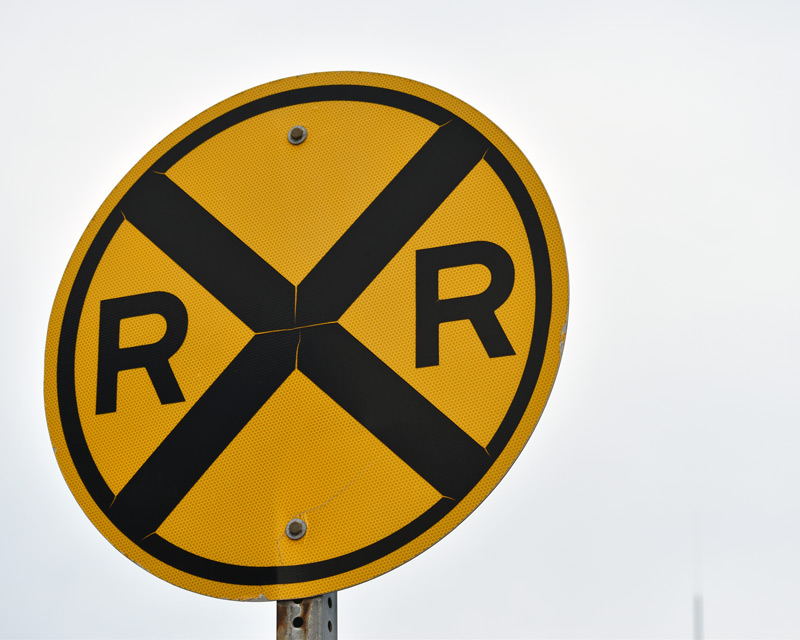
A safe transportation system requires constant effort, maintenance, and accountability. Roadway fatalities declined by roughly 20% from their pandemic peak, but CY23 to CY24 saw notable increases in rail grade crossing incidents and in roadway fatalities.
This includes 26 grade crossing incidents, 9 work zone fatalities, and 78 pedestrian fatalities—a 16% increase. Similarly, injuries were up 13% at the RTAs in CY24.
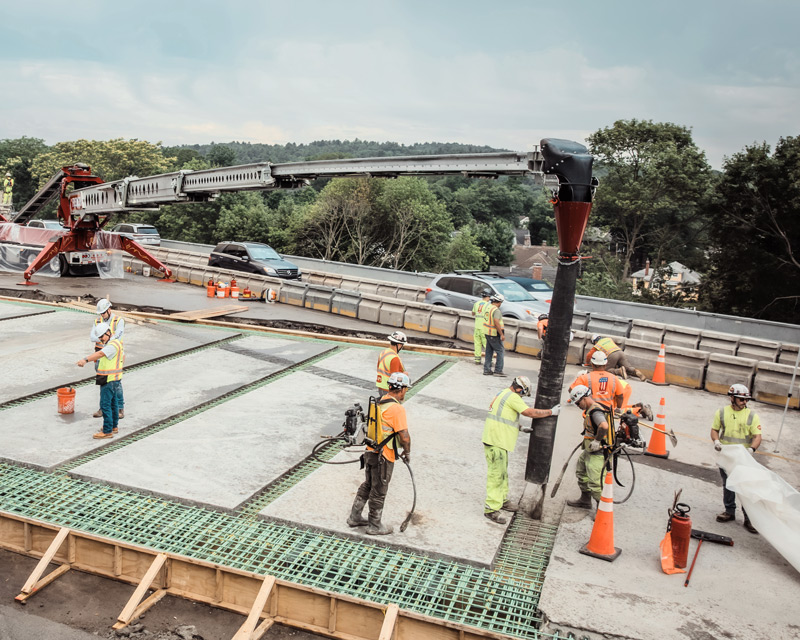
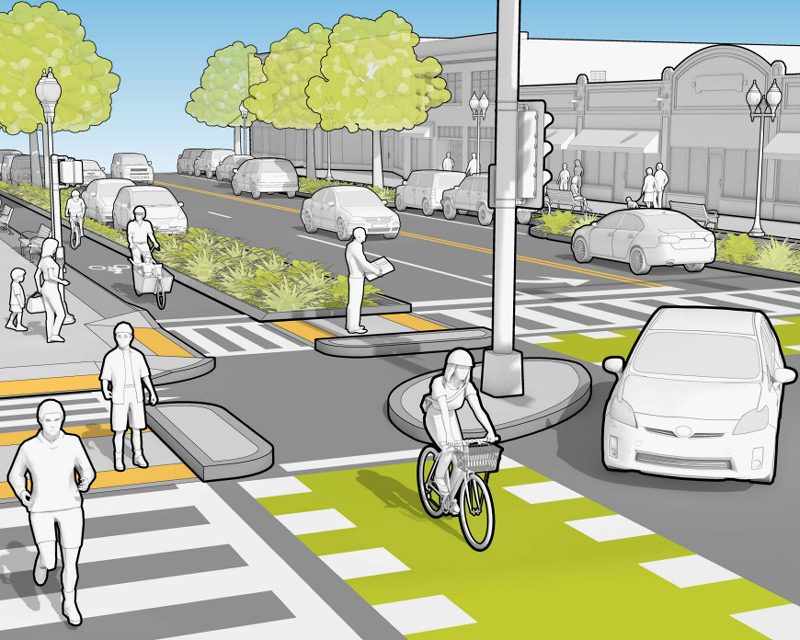
MassDOT, the MBTA, and the Commonwealth’s RTAs are taking active measures to address these safety hazards. The Highway Division is adopting a Safe System Approach for roadway design, expanding support for community-driven roadway and pedestrian safety campaigns, and rolling out a new work zone management system.
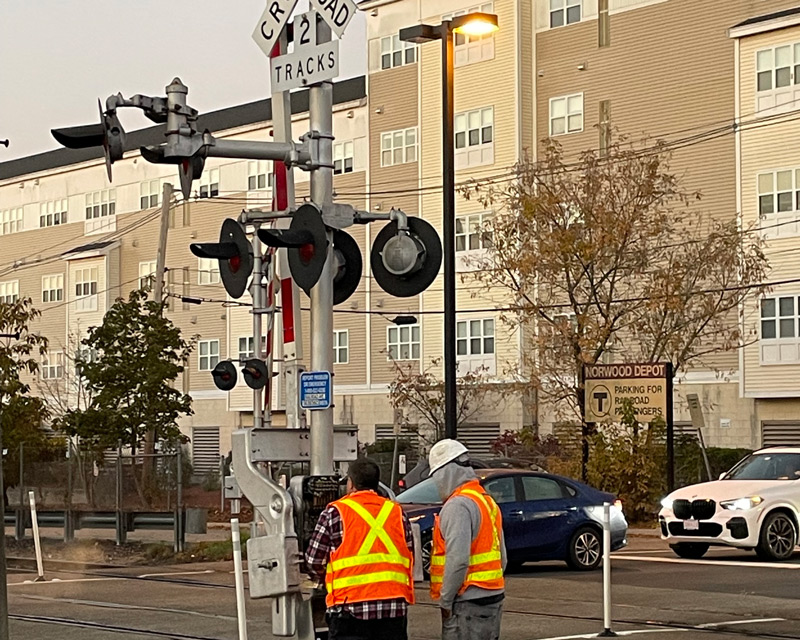
The MBTA updated safety investigation processes and software tools to better address systemic issues, while also partnering with the Rail Division to invest in enhanced visibility infrastructure at high-risk grade crossings.
These initiatives are part of a broader commitment to safety that includes annual partnerships with Operation Lifesaver, a national nonprofit raising awareness about the dangers of trespassing on railway properties, and with Samaritans, a nonprofit dedicated to preventing suicides.
Safety
MassDOT is committed to advancing a future without transportation-related serious injuries and fatalities and eliminating the disparity in crash rates between Environmental Justice communities and all other groups. While our work is never complete when it comes to the safety of our residents, we are proud to report that safety has improved across all our MassDOT Divisions in FY25.
Following an increase in safety incidents as travel increased post-COVID, serious injuries on roadways decreased 4.3% from CY23 to CY24.
On transit, there were lower rates of safety events across the MBTA bus and subway systems, plus zero total fatalities across all 15 Regional Transit Authorities (RTAs).
The Commonwealth launched several new initiatives to meet safety standards and to help ensure that safety continues to improve for all users and employees.
One such initiative was the MBTA Track Improvement Program that implemented track repairs across all rapid transit lines to address long-term speed restrictions that were degrading the MBTA’s service quality.
The Track improvement Program enhanced safety, reduced delays and disruptions, improved train speeds and delivered timely, reliable, and consistent service for riders.
After replacing over 250,000 feet of rail, the MBTA eliminated over 220 speed restrictions–becoming completely restriction-free by December 2024–effectively resolving 40 years of repairs in 14 months.
This effort resulted in more efficient work scheduling, cross-department collaboration, and speed restrictions returning to a temporary safety measure. New speed restrictions opened from April – June of 2025 were removed in fewer than 3 days 77% of the time and the median restriction was removed in 2 days.
Across MassDOT, promoting safety in transportation is embedded in our day-to-day work. The RMV plays a central role in promoting roadway safety by overseeing driver licensing and suspensions, vehicle inspection and registration services, driver education, school transportation safety programs, crash reporting, and the ignition interlock program, while the Aeronautics Division manages regional airport inspections and has scaled up its support of safety-related preventative maintenance efforts across the Commonwealth through its drone mission program.
A safe transportation system requires constant effort, maintenance, and accountability. While we celebrate the nearly 20% decline in roadway fatalities from their pandemic peak, there are spikes in certain categories that the organization continues to monitor.
This includes 26 grade crossing incidents, 9 work zone fatalities, and 78 pedestrian fatalities, a 16% increase. Similarly, injuries were up 13% at the RTAs in CY24.
MassDOT, the MBTA, and the Commonwealth’s RTAs are taking active measures to address these safety hazards. The Highway Division is adopting a Safe System Approach for roadway design, expanding support for community-driven roadway and pedestrian safety campaigns, and rolling out a new work zone management system.
The MBTA updated safety investigation processes and software tools to better address systemic issues, while also partnering with the Rail Division to invest in enhanced visibility infrastructure at high-risk grade crossings.
These initiatives are part of a broader commitment to safety that includes annual partnerships with Operation Lifesaver, a national nonprofit raising awareness about the dangers of trespassing on railway properties, and with Samaritans, a nonprofit dedicated to preventing suicides.