
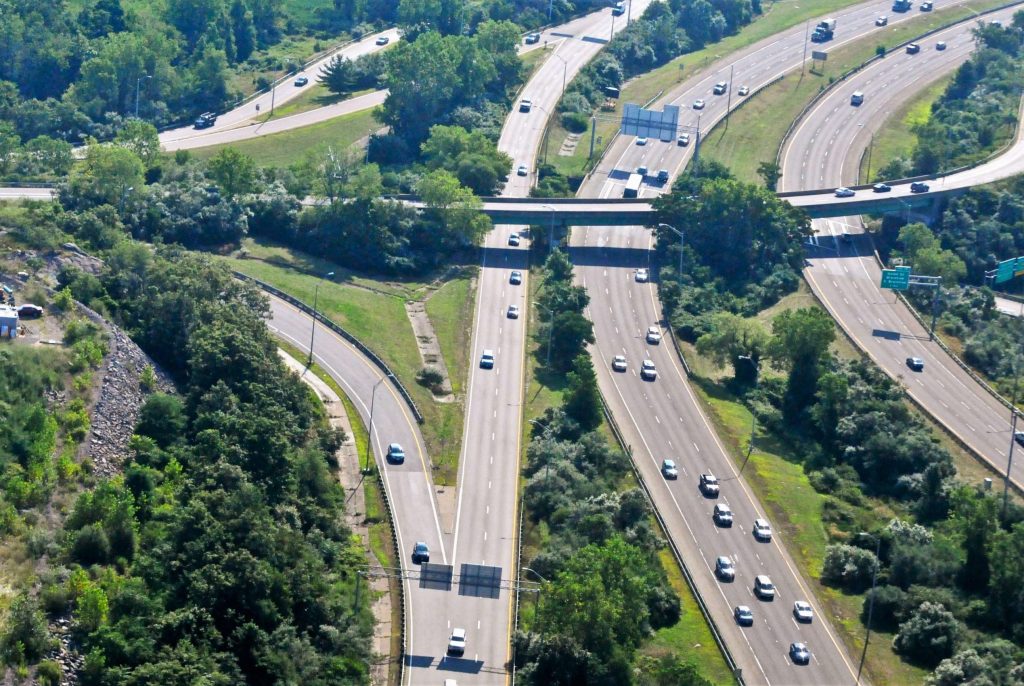
As residents and visitors travel across the Commonwealth to where they need to go, whether by transit, automobile, walking or bicycle, it is MassDOT’s goal that the trip is safe, convenient, and reliable. However, in recent years, congestion has become an increasingly pervasive issue in the Greater Boston area as well as across the state. Congestion affects travel times and reliability, and therefore the experience of those traveling in our state.
MassDOT and the MBTA are monitoring congestion and planning for a variety of mitigations. A part of that planning process involves adapting our roadways to support more transportation options to decrease single-occupancy vehicle trips. A few examples of such programs are the Shared Streets and Spaces grant program (MassDOT grants for municipalities looking to improve plazas, sidewalks, curbs, streets, parking areas, and other public spaces in support of public health, safe mobility, and renewed commerce), rapid recovery bus lanes, and Complete Streets.
Commute Time
Most research indicates that approximately 15 to 20 percent of trips are work related. The time it takes Massachusetts residents to travel to work is the outcome of many factors, including: roadway congestion (which itself is the product of economic conditions and infrastructure capacity); land use patterns that influence where residents live and work; and the travel modes that people can choose from. While many of these factors are outside of MassDOT’s direct control, average commute time is a useful indicator of how efficient the entire transportation network is. Since this measure is situational, MassDOT has not defined an optimal commute time; a downward trend is desirable (from the standpoint of the health of the environment and quality of life for residents), but the average commute time has steadily increased for the past five years. Commute time data comes from the US Census American Community Survey (ACS). The most recent ACS estimate for the average commute time for the state is 29.6 minutes in CY21.
Average Commute Time by County
Average Commute Time by Mode
Mode Share
MassDOT’s goal is to provide transportation options to give people access to opportunities and to where they need and want to go. Additionally, MassDOT’s goal is to help make modes of travel with social, health and environmental benefits available and attractive options. One of the ways we can track our progress towards these goals is by looking at mode share – the percentage of trips taken in the state by the various transportation modes. MassDOT’s goal is to increase the mode share of people using sustainable modes of travel (biking, walking, and public transit). In CY21, the overall primary mode share of commute types for the Commonwealth is as follows:
- 66.0% drove alone
- 11.8% worked from home
- 8.4% used public transportation
- 7.0% carpooled
- 4.6% walked
- 1.4% took a taxicab, motorcycle, or used other means
- 0.8% took a bicycle
While a person’s mode choice is determined by numerous factors, MassDOT can impact some of the variables that affect the commute mode choice decision. For example, improving reliability and frequency of key public transit routes could compel more people to choose public transit over driving, which in turn decreases congestion.