
The expansive service and prominent regional position of the MBTA means it has significant potential to alleviate congestion and mitigate greenhouse gas (GHG) emissions from single-occupancy vehicles through mode shift — trips taken on transit that may have otherwise been taken by car. Measures such as ridership provide context for mode shift, while GHG emissions reductions and bus electrification efforts work to advance healthy and sustainable transportation in the region.
Ridership
Ridership measures the number of rides the MBTA system provides each year. In accordance with industry standard, ridership is measured as unlinked passenger trips (UPT), which reflect each time a passenger boards a transit vehicle. Unlinked passenger trips include estimates for trips that are not directly measured, such as transfers that do not involve fare equipment and trips in which riders do not interact with the fare system. Ridership estimates for FY23 may be adjusted slightly in the future.
Ridership estimates for FY22 may be adjusted slightly in the future. Ridership may not match annual and monthly ridership estimates reported to the National Transit Database (NTD) due to new data that may become available after reports are submitted, such as from Green Line vehicles. The most current ridership estimates can be found on the MBTA Performance Dashboard.
In FY23, the MBTA emitted 237.8 million kg CO2e, a 2.6 percent decrease from 244.2 million kg CO2e in FY22. The Commonwealth of Massachusetts aims to reduce GHG emissions by 80 percent by 2050 compared to 2005 levels, and the MBTA is on track to meet that goal. In FY23, the MBTA made headway towards this GHG reduction target, reducing GHG by 43.8% from a 2009 baseline. The MBTA is still committed to Net-zero by 2050. The rate of GHG emissions was 1.02 kg CO2e per UPT in FY23, a 15.4 percent decrease from 1.21 in FY22.
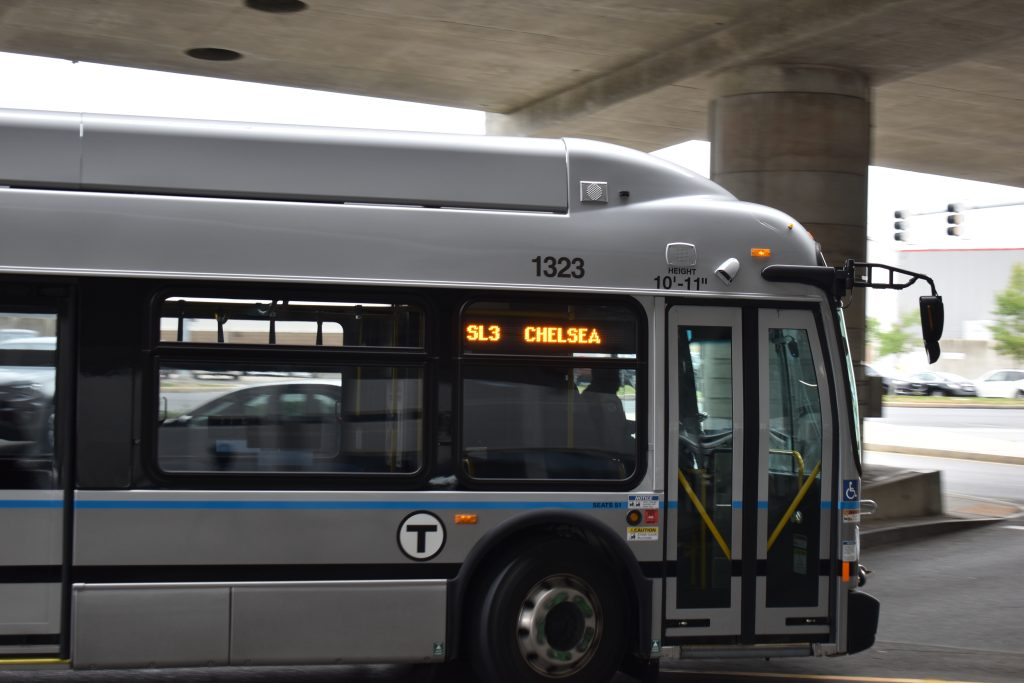
Bus fleet composition particularly impacts residents living near bus routes due to air pollutants emitted. While diesel-only buses emit higher levels of criteria air pollutants, alternative fuel buses (including electric, CNG, and hybrid) can mitigate air pollution caused by buses for nearby residents. Of residents living within a quarter mile of MBTA bus routes in FY23, roughly 47 percent were near routes running alternative fuel vehicles, 44 percent were near routes running vehicles of mixed fuel types, and 9 percent were near routes running diesel-only buses. For low-income households within a quarter mile of MBTA bus routes, roughly 38 percent were near alternative fuel routes, and 13 percent were near diesel-only routes. For the purpose of standardization, low-income households are defined as a household earning less than $82,000 per year. Of residents of color living near MBTA bus routes, 55 percent were near alternative fuel routes and 10 percent were near diesel-only routes.