
The MBTA owns and operates one of the oldest and largest public transportation agencies in the US, serving more than 1.2 million passenger trips each weekday before the COVID-19 pandemic. The MBTA’s services, or modes, include:
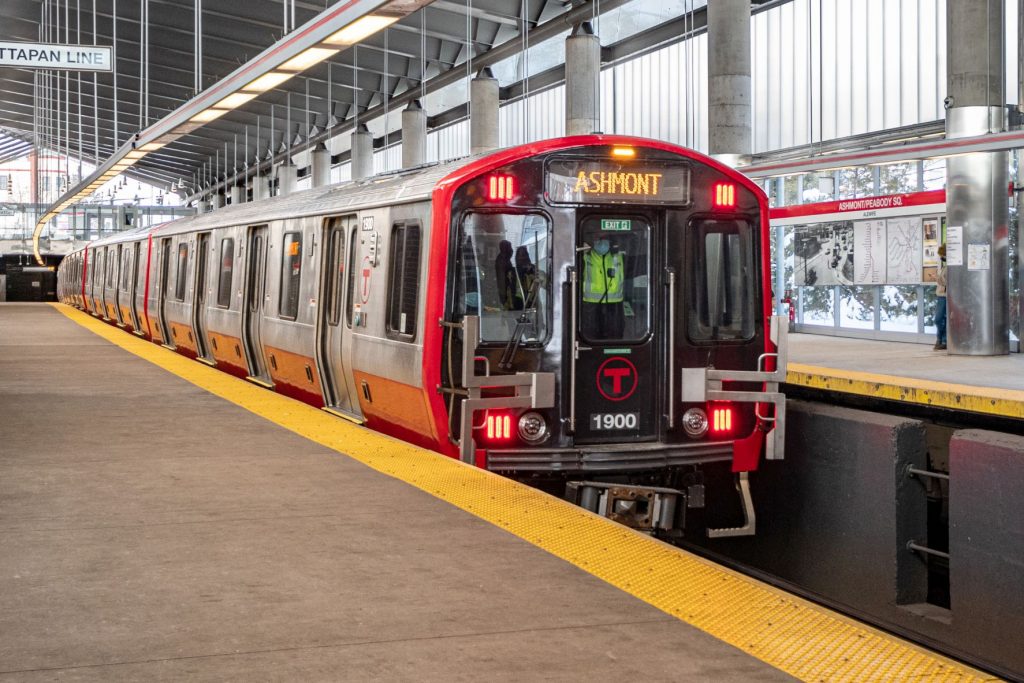
- Heavy Rail — The MBTA operates three heavy rail lines: the Red Line, Blue Line, and Orange Line. Collectively, these lines provide core subway services.
- Light Rail — The MBTA’s primary light rail system, the Green Line, provides services to outlying areas to the west and subway service through the center of the city. The MBTA also operates the Mattapan Trolley, which serves as an extension of the Red Line from Ashmont to Mattapan.
- Bus — The MBTA operates more than 170 bus routes directly or via contract, including five bus rapid transit routes via the Silver Line and 15 key routes that offer frequent service to higher-ridership corridors. Local bus routes, commuter or express routes, and supplemental routes comprise the rest of MBTA bus service.
- Commuter Rail — The MBTA’s 12 primary commuter rail lines link cities and towns around the state with downtown Boston, while also providing regional connections.
- Ferry — The MBTA provides ferry services on two routes between downtown Boston, the South Shore, Logan Airport, and Charlestown.
- Paratransit — The MBTA provides paratransit service via The RIDE to eligible customers in 58 cities and towns in eastern Massachusetts.
MBTA System Map
MBTA Performance Measurement
The MBTA uses performance measures to track progress toward goals, provide accountability and transparency, and plan for future programs and investments. Several current initiatives and plans include goals and performance measures that align with those included in Tracker. To ensure alignment among these efforts, OPMI has worked closely with MBTA and MassDOT staff and MBTA Fiscal and Management Control Board (FMCB) members in the development and presentation of these performance measures and targets. The following plans and performance tools are related to Tracker:
- MBTA Service Delivery Policy
- MBTA Performance Dashboard
- MBTA Strategic Plan
- MBTA Open Data Portal
- Focus40
- Rail Vision
MBTA Scorecard
| Performance Goal | Performance Metric | Current Performance (CY22) | CY21 | 2023 Target |
|---|---|---|---|---|
 Safety Safety |
Fatalities (Bus) | 0 | 0 | 0 | Fatalities (Commuter Rail) | 4 | 1 | 0 | Fatalities (Heavy Rail) | 1 | 0 | 0 | Fatalities (Light Rail) | 0 | 0 | 0 | Fatalities (The RIDE) | 0 | 0 | 0 | Mainline Non-Revenue Train Derailments (Commuter Rail) | 1 | 0 | 1 | Mainline Non-Revenue Train Derailments (Heavy Rail) | 0 | 1 | 0 | Mainline Non-Revenue Train Derailments (Light Rail) | 1 | 0 | 2 | Mainline Revenue Train Derailments (Commuter Rail) | 0 | 0 | 1 | Mainline Revenue Train Derailments (Heavy Rail) | 0 | 2 | 1 | Mainline Revenue Train Derailments (Light Rail) | 1 | 0 | 2 | Mean Miles Between Failures (Bus) | 18,718 | 28,638 | 29,500 | Mean Miles Between Failures (Heavy Rail) | 55,222 | 44,617 | 44,500 | Mean Miles Between Failures (Light Rail) | 6,618 | 7,780 | 7,650 | Mean Miles Between Failures (The RIDE) | 27,575 | 26,334 | 62,500 | NTD Reportable Injuries (Bus) | 277 | 264 | 286 | NTD Reportable Injuries (Heavy Rail) | 202 | 184 | 180 | NTD Reportable Injuries (Light Rail) | 104 | 88 | 79 | NTD Reportable Injuries (The RIDE) | 20 | 29 | 27 | Rate of Collisions (Bus – Per 1M Revenue Miles) | 74.78 | 58.6 | 60.08 | Rate of Collisions (Heavy Rail – Per 1M Revenue Miles) | 2.42 | 1.31 | 0.88 | Rate of Collisions (Light Rail – Per 1M Revenue Miles) | 5.37 | 4.53 | 2.86 | Rate of Fatalities (Bus – Per 1M Revenue Miles) | 0 | 0 | 0 | Rate of Fatalities (Commuter Rail – Per 1M Revenue Miles) | 3.7 | 0 | 0 | Rate of Fatalities (Heavy Rail – Per 1M Revenue Miles) | < 0.01 | 0 | 0 | Rate of Fatalities (Light Rail – Per 1M Revenue Miles) | 0 | 0 | 0 | Rate of Fatalities (The RIDE – Per 1M Revenue Miles) | 0 | 0 | 0 | Rate of NTD Reportable Injuries (Bus – Per 1M Revenue Miles) | 12.7 | 11.01 | 12.23 | Rate of NTD Reportable Injuries (Heavy Rail – Per 1M Revenue Miles) | 10.64 | 8.39 | 7.99 | Rate of NTD Reportable Injuries (Light Rail – Per 1M Revenue Miles) | 17.44 | 16.6 | 14.35 | Rate of NTD Reportable Injuries (The RIDE – Per 1M Revenue Miles) | 2.41 | 2.91 | 2.27 | Rate of Safety Events (Bus – Per 1M Revenue Miles) | 4.54 | 3.71 | 4.21 | Rate of Safety Events (Heavy Rail – Per 1M Revenue Miles) | 1.32 | 1.09 | 1.07 | Rate of Safety Events (Light Rail – Per 1M Revenue Miles) | 5.53 | 3.21 | 4.94 | Rate of Safety Events (The RIDE – Per 1M Revenue Miles) | 4.46 | 3.21 | 1.74 | Yard/Shop Train Derailments (Commuter Rail) | 1 | 0 | 1 | Yard/Shop Train Derailments (Heavy Rail) | 1 | 3 | 4 | Yard/Shop Train Derailments (Light Rail) | 1 | 1 | 4 |
| Performance Goal | Performance Metric | Current Performance (FY23) | FY22 | 2022 Target | 2024 Target | Long Term Target |
|---|---|---|---|---|---|---|
 Budget & Capital Expenditures Budget & Capital Expenditures |
Actual Total Expenses | $2.32B | $2.21B | $2.35B | – | – | Actual Total Expenses Growth Rate | 5.20% | 2.00% | Context Only | Actual Total Non-Operating Expenses (Debt Service) | $491M | $474M | Actual Total Non-Operating Revenues | $1.89B | $2.64B | Actual Total Operating Expenses | $1.83B | $1.73B | Actual Total Operating Revenues | $446M | $382M | Actual Total Revenues | $2.34B | $3.02B | $2.77B | – | – | Actual Total Revenues Growth Rate | -23% | 14% | Context Only | Average Elapsed Days Between Advertising and NTP | 126 days | 113 days | 130 days | 130 days | 130 days | Fare Recovery Ratio | 21% | 19% | 45% | – | 50% | Projects Completed On or Under Budget | 20% | 100% | Context Only | Projects Completed On or Under Time | 40% | 75% | Total CIP Spend | $1.85B | $1.61B | $2.00B | – | – | Total CIP Spend (Expansion) | $325M | $493M | $548M | – | – | Total CIP Spend (Reliability/Modernization) | $1.53B | $1.11B | $1.45B | – | – | Total Spend vs. CIP Spend Target | 93% | 61% | Context Only | Actual Closing Balance (Revenue – Expenses) | $14M | $816M | $417M | – | – | Actual Non-Operating Revenue Details (Other) | $47M | $988M | Context Only | Actual Non-Operating Revenue Details (State and Local) | $1.84B | $1.65B | Actual Operating Expense Details (Contracted Transit Services) | $632M | $583M | Actual Operating Expense Details (Materials and Services) | $305M | $288M | Actual Operating Expense Details (Other) | $29M | $25M | Actual Operating Expense Details (Wages and Benefits) | $865M | $838M | Actual Operating Expenses Growth Rate | 5.6% | 6.0% | Actual Operating Revenue Details (Fares) | $376M | $322M | Actual Operating Revenue Details (Other) | $70M | $60M | Actual Operating Revenues Growth Rate | 17% | 90% |
| Performance Goal | Performance Metric | Current Performance (FY23) | FY22 | 2022 Target | 2024 Target | 2026 Target | Long Term Target |
|---|---|---|---|---|---|---|---|
 Customer Experience Customer Experience |
Average Percent of Weekday Passenger Miles with Direct Benefit from Bus Priority Corridors | 7.50% | 5.70% | Context Only | Average Percent of Weekday Passenger Miles with Indirect Benefit from Bus Priority Corridors | 60% | 51% | Average Weekday Passenger Miles in Bus Priority Corridors | 54,000 | 38,000 | Bus Reliability (Key Bus) | 78% | 78% | 80% | 80% | 80% | – | Bus Reliability (Other Bus) | 66% | 69% | 75% | 75% | 75% | – | Bus Reliability (Silver Line) | 81% | 81% | 80% | 80% | 80% | – | Commuter Rail Reliability | 91% | 92% | 90% | 90% | 90% | – | Elevator Uptime | 98.70% | 98.60% | 99.70% | 99.70% | – | 100% | Ferry Reliability | 100% | 99% | 97% | 97% | 97% | – | Number of Other Priority PATI Bus Stops Constructed | 11 | 92 | Context Only | Number of Other Priority PATI Bus Stops Designed | 35 | 100 | Percent of Critical-Priority PATI Bus Stops Constructed | 57% | 37% | – | 100% | 100% | 100% | Percent of Critical-Priority PATI Bus Stops Designed | 43% | 39% | – | 100% | 100% | 100% | Percent of High-Priority PATI Bus Stops Constructed | 24% | 20% | – | 25% | 45% | 100% | Percent of High-Priority PATI Bus Stops Designed | 51% | 22% | – | 30% | 60% | 100% | Station Accessibility (Unweighted) | 78.90% | 77.80% | 77.30% | 81.40% | 87.00% | 100% | Subway Reliability (Blue Line) | 95% | 96% | 90% | 90% | 90% | – | Subway Reliability (Green Line) | 78% | 79% | 90% | 90% | 90% | – | Subway Reliability (Orange Line) | 92% | 91% | 90% | 90% | 90% | 95% | Subway Reliability (Red Line) | 90% | 90% | 90% | 90% | 90% | 95% | The RIDE Reliability | 88% | 89% | 90% | 90% | 90% | 90% | Total Active Bus Priority Miles | 41.87 | 42.87 | Context Only | Total Active Transit Signal Priority (TSP) Signals | 91 | 86 |
| Performance Goal | Performance Metric | Current Performance (FY23) | FY22 | 2024 Target |
|---|---|---|---|---|
 System Condition System Condition |
Facility Condition – Assets Scoring Lower Than 3 on TERM Scale (Administrative/Maintenance Facilities) | 22.8% | 35% | 22.8% | Facility Condition – Assets Scoring Lower Than 3 on TERM Scale (Passenger/Parking Facilities) | 2.6% | 6% | 3.1% | Non-Revenue Service Vehicle Condition – Beyond Useful Life (Transit and Commuter Rail) | 48.5% | 22% | 50.8% | Rolling Stock – Beyond Useful Life (Articulated Bus) | 21.2% | 0% | 23.7% | Rolling Stock – Beyond Useful Life (Bus) | 20.0% | 32% | 17.3% | Rolling Stock – Beyond Useful Life (Commuter Rail Coach) | 7.5% | 7% | 6.8% | Rolling Stock – Beyond Useful Life (Commuter Rail Locomotive) | 22.9% | 23% | 22.9% | Rolling Stock – Beyond Useful Life (Ferry) | 0% | 0% | 0% | Rolling Stock – Beyond Useful Life (Heavy Rail) | 30.1% | 53% | 28.6% | Rolling Stock – Beyond Useful Life (Light Rail) | 40.5% | 0% | 40.5% | Rolling Stock – Beyond Useful Life (Paratransit Automobile) | 0% | 0% | 0.0% | Rolling Stock – Beyond Useful Life (Paratransit Van) | 0% | 0% | 25.1% | Rolling Stock – Beyond Useful Life (Vintage Trolley) | 100% | 100% | 100% | Track Condition – Miles with Speed Restrictions (Commuter Rail) | 3.0% | 3% | 4.0% | Track Condition – Miles with Speed Restrictions (Heavy Rail) | 13.2% | 7% | 17.2% | Track Condition – Miles with Speed Restrictions (Light Rail) | 7.4% | 2% | 15.6% |
| Performance Goal | Performance Metric | Current Performance (FY23) | FY22 | 2022 Target | 2024 Target | 2026 Target | Long Term Target |
|---|---|---|---|---|---|---|---|
 Healthy & Sustainable Transportation Healthy & Sustainable Transportation |
Bus Fleet Composition (Compressed Natural Gas – CNG) | 16% | 15% | Context Only | Bus Fleet Composition (Diesel) | 18% | 37% | Bus Fleet Composition (Electric) | 0.5% | 0.4% | – | 3.1% | 13.7% | 100% | Bus Fleet Composition (Hybrid) | 65% | 48% | Context Only | Percent Reduction in Greenhouse Gas Emissions from 2009 Baseline | 44% | 42% | – | – | 20% | 50% | Rate of Greenhouse Gas Emissions (kg CO2e Per UPT) | 1.02 | 1.21 | Context Only | Ridership (UPT) | 233,094,592 | 202,597,697 | Total Greenhouse Gas Emissions (kg CO2e) | 237,759,082 | 244,188,484 |