
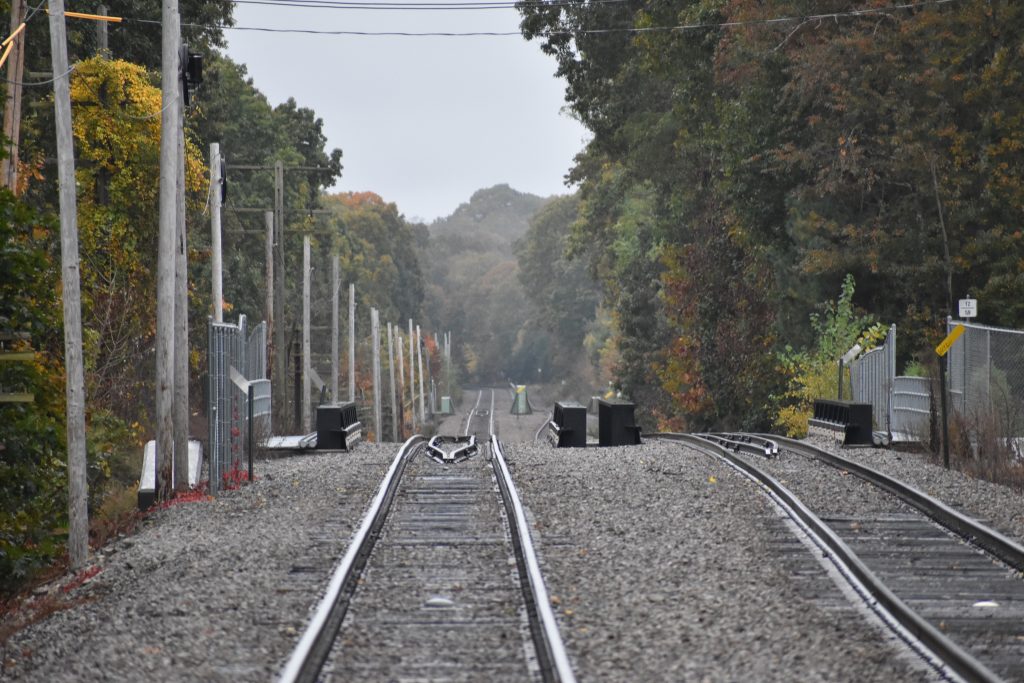
The MassDOT Rail & Transit Division manages freight, passenger, and seasonal rail lines across the state and maintains its rail assets. This includes overseeing the administration of former and current railroad property, supporting logistics efforts to reduce trucks on the road by shipping more goods via rail, and increasing the safety and reliability of rail traffic through grade crossing improvements.
The Division’s property staff handles Chapter 40/54A administrative hearings to address the use of former railroad property and to ensure the safety of rail travel during new building construction near railroad rights-of-way. Part of this involves the issuance of 50-100 licenses annually to contractors, utilities, cities, towns, and private owners that need access or are working next to right-of-way for construction; the design and appropriate administrative review of this range of licenses requires extensive staff time.
Additionally, staff manage Chapter 161C applications for the sale of former or existing railroad property – a lengthy process involving extensive canvassing of impacted operating railroads (which may include the MBTA Commuter Rail).
The Industrial Rail Access Program (IRAP), run by Rail & Transit, aims to minimize truck traffic by shifting goods delivery to rail. An annual program started in 2012 and funded by a three-million-dollar state bond and clients’ matching funds, IRAP works with railroads and logistics companies to build sidings and provide off-loading equipment that increases their processing capacity. The program supports at least six major investment projects annually.
Funding from the Federal Highway Administration (FHWA) Railway-Highway Crossings Program (Section 130) enables Rail & Transit to rebuild or improve at-grade crossings throughout Massachusetts. Federal funding varies annually but typically provides at least $2.5 million (with a limited state match requirement). The Division utilizes its Asset Management Plan and annual asset assessments to guide project prioritization and budgeting.
Since the peak of the COVID-19 pandemic, the negative impacts to rail maintenance and operations have begun to ease. Lockdowns and supply chain disruptions impacted the Rail & Transit Division’s ability to procure sufficiently staffed contractors and procure necessary materials for maintenance. In 2023, the situation has much improved, but staffing issues persist as an occasional problem. Incidents of COVID-19 infections have delayed project timelines but, overall, the negative impacts of the virus are far less than two years ago.
State-supported passenger rail operations also suffered impacts from the pandemic with ridership plummeting to historic lows. Fortunately, as the public health toll has decreased and additional investments have been made, FY23 ridership along the Knowledge Corridor – including the Vermonter, Hartford Line, and Valley Flyer services – have exceeded those of FY19 by 23%, increasing from 135,758 annual riders to 170,314 riders.
Scorecard
| Performance Goal | Performance Measure | Current Performance (FY23) | FY22 | 2024 Target | 2026 Target | Long Term Target |
|---|---|---|---|---|---|---|
 Budget & Capital Expenditures Budget & Capital Expenditures |
Capital Budget Spent | 81% | 59% | 90% | 90% | 95% | Hartford Line Ridership | 135,141 | 97,338 | Context Only | Vermonter Ridership | 35,173 | 25,842 |
 Safety Safety |
Number of Derailments – Per 1,000 Track Miles (Five Year Rolling Average) | 3.7 | 4 | 0 | 0 | 0 | Number of Highway-Rail Incidents – Per 1,000 Grade Crossings (Five Year Rolling Average) | 10.2 | 9 | 0 | 0 | 0 | Number of Reported Hazmat Incidents – Per 1,000 Track Miles (Five Year Rolling Average) | 0.9 | 1.2 | 0 | 0 | 0 |
 System Condition System Condition |
Bridge (Percent Good and Excellent Condition) | 21% | 24% | 39% | 45% | 85% | Bridge (Percent Poor and Non-Operable) | 8% | 7% | 3% | 2% | 1% | Culvert (Percent Good and Excellent Condition) | 13% | 12% | 15% | 26% | 85% | Culvert (Percent Poor and Non-Operable) | 12% | 12% | 9% | 7% | 1% | Grade Crossing (Percent Good and Excellent Condition) | 59% | 56% | 62% | 65% | 85% | Grade Crossing (Percent Poor and Non-Operable) | 1% | 3% | 1% | 1% | 1% | Inspections by Asset Type – Bridge | 97% | 95% | 100% | 100% | 100% | Inspections by Asset Type – Culvert | 88% | 91% | 100% | 100% | 100% | Inspections by Asset Type – Grade Crossing | 100% | 95% | 100% | 100% | 100% | Inspections by Asset Type – Track Segment | 100% | 93% | 100% | 100% | 100% | Track Segment (Percent Good and Excellent Condition) | 74% | 62% | 80% | 82% | 85% | Track Segment (Percent Poor and Non-Operable) | 0% | 1% | 1% | 1% | 1% |